✎ᝰ plotting.vif
The VIFPlotter class provides functionality to visualize the Variance Inflation Factor (VIF)
for features in a dataset. This module helps users detect multicollinearity by generating
informative bar plots of VIF values for each feature.
Overview
The module exposes a plotter class that:
Accepts a pandas DataFrame with VIF values and feature names
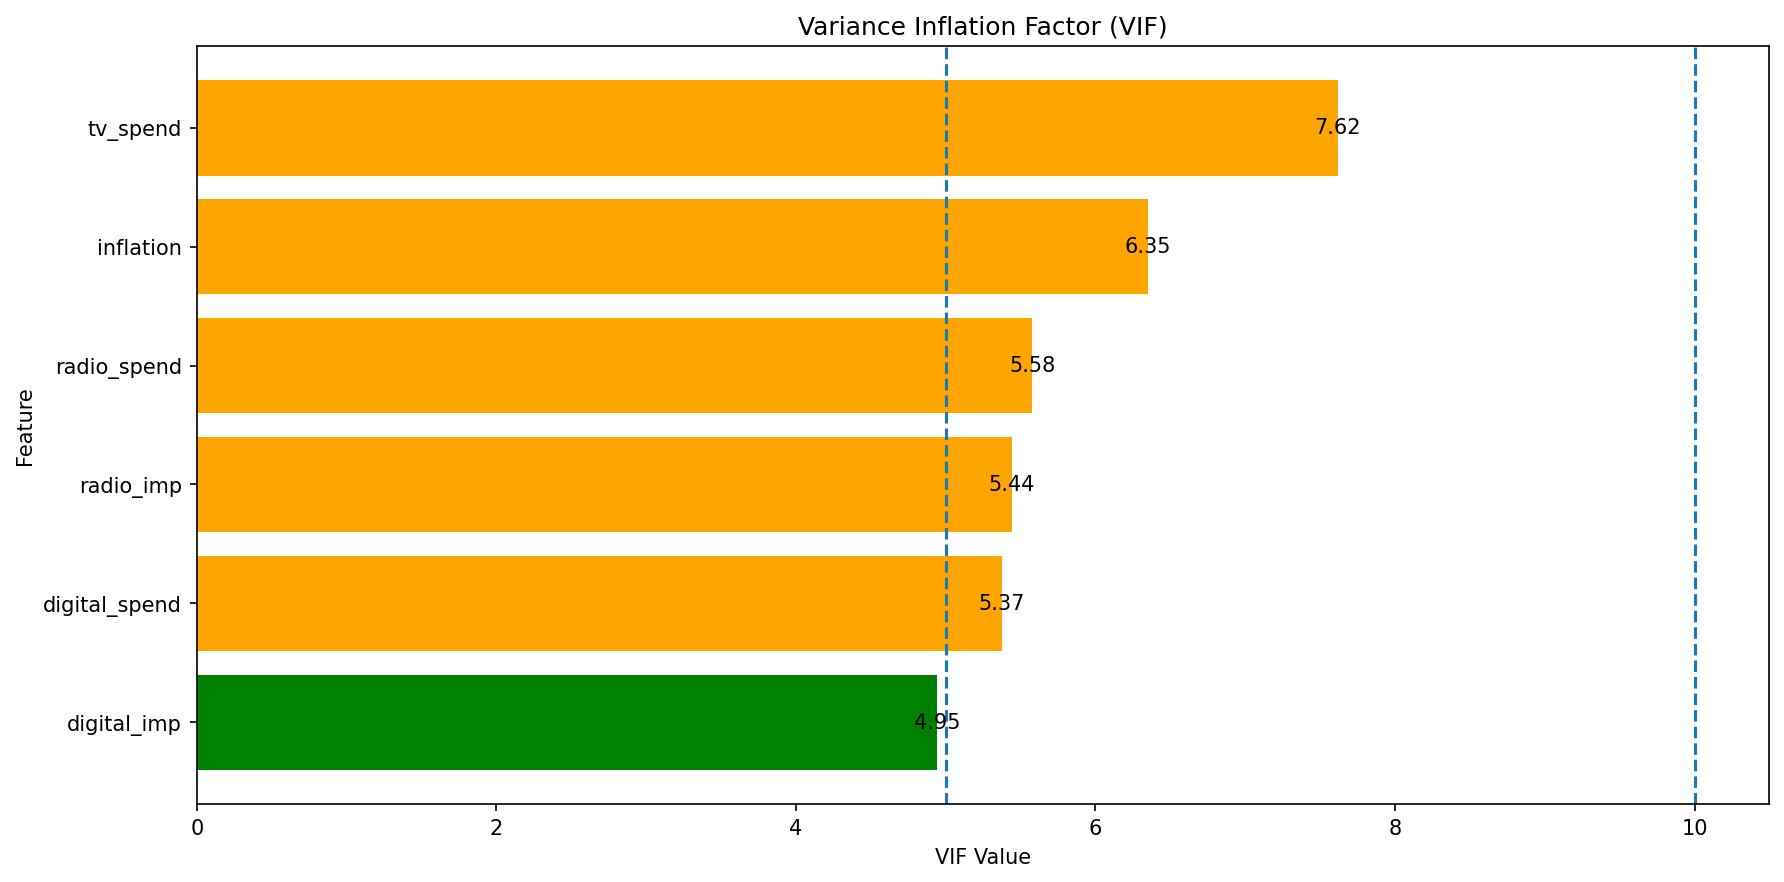
Plots VIF values for each feature as a horizontal bar chart
Highlights common VIF thresholds (5 and 10) for interpretation
Supports output directory customization and plot styling
Class Reference
- class owlmix.plotting.vif.VIFPlotParams
Dataclass for specifying VIF plotting parameters.
- class owlmix.plotting.vif.VIFPlotter(data, params)
Plots the Variance Inflation Factor (VIF) for features in a pandas DataFrame.
- Parameters:
data (
pandas.DataFrame) – Input DataFrame containing feature names, VIF values, and colors.params (
VIFPlotParams) – Configuration parameters for VIF plotting.
- generate(output_dir: str = 'outputs/charts') str
Generates and saves a horizontal bar plot of VIF values for each feature.
- Parameters:
output_dir (
str) – Directory to save the generated plot.- Returns:
File path to the saved VIF chart image.
- Return type:
str
Sample Output
The VIF plot consists of a horizontal bar chart where each bar represents the VIF value for a feature. Dashed vertical lines at VIF=5 and VIF=10 indicate common thresholds for multicollinearity concerns. VIF values are annotated on each bar for clarity.