✎ᝰ plotting.box_plot
The BoxPlotter class provides functionality to visualize the distribution
of data using box plots. This module is designed to help users understand the spread,
central tendency, and outliers in their data by generating informative box plot grids.
Overview
The module exposes a plotter class that:
Accepts a dictionary of statistics for each column
Plots box plots for each column in a grid layout
Supports configurable number of plots per row
Leverages matplotlib and numpy for visualization
Class Reference
- class owlmix.plotting.box_plot.BoxPlotParams(n_plot_per_row=4)
Dataclass for specifying box plot grid parameters.
- Parameters:
n_plot_per_row (
int) – Number of box plots per row in the grid.
- class owlmix.plotting.box_plot.BoxPlotter(data, params=BoxPlotParams)
Plots box plots for the provided data statistics.
- Parameters:
data (
Dict[str, Dict[str, Any]]) – Dictionary containing statistics for each column.params (
BoxPlotParams) – Configuration parameters for box plot grid.
- generate(output_dir: str = 'outputs/charts') str | None
Generates and saves a grid of box plots for the provided data.
- Parameters:
output_dir (
str) – Directory to save the generated plot image.- Returns:
File path to the saved box plot grid image, or None if no data.
- Return type:
Optional[str]
Sample Output
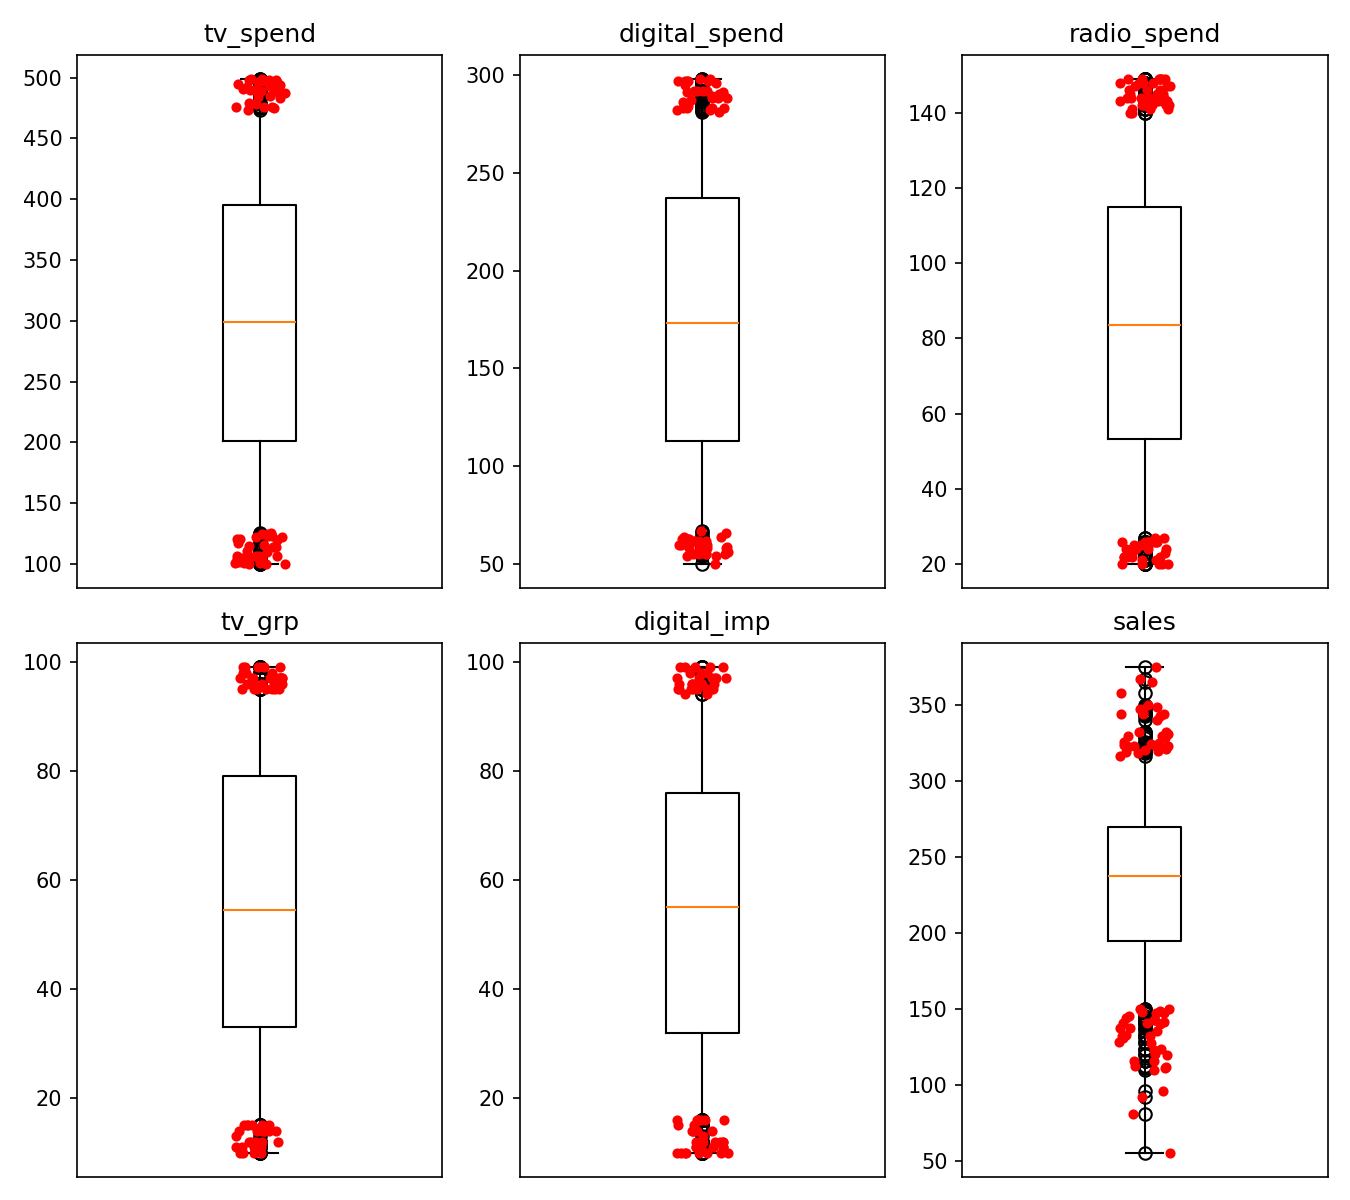
A box plot grid typically consists of multiple subplots, each representing the distribution of a column. Each box shows the median, quartiles, whiskers (min/max), and outliers (if any). Outliers are highlighted in red.