✎ᝰ plotting.correlation
The CorrelationPlotter class provides functionality to visualize correlation
matrices and lagged correlation matrices for tabular data. This module helps users
understand the relationships between variables by generating informative heatmaps.
Overview
The module exposes a plotter class that:
Accepts correlation analysis results as input
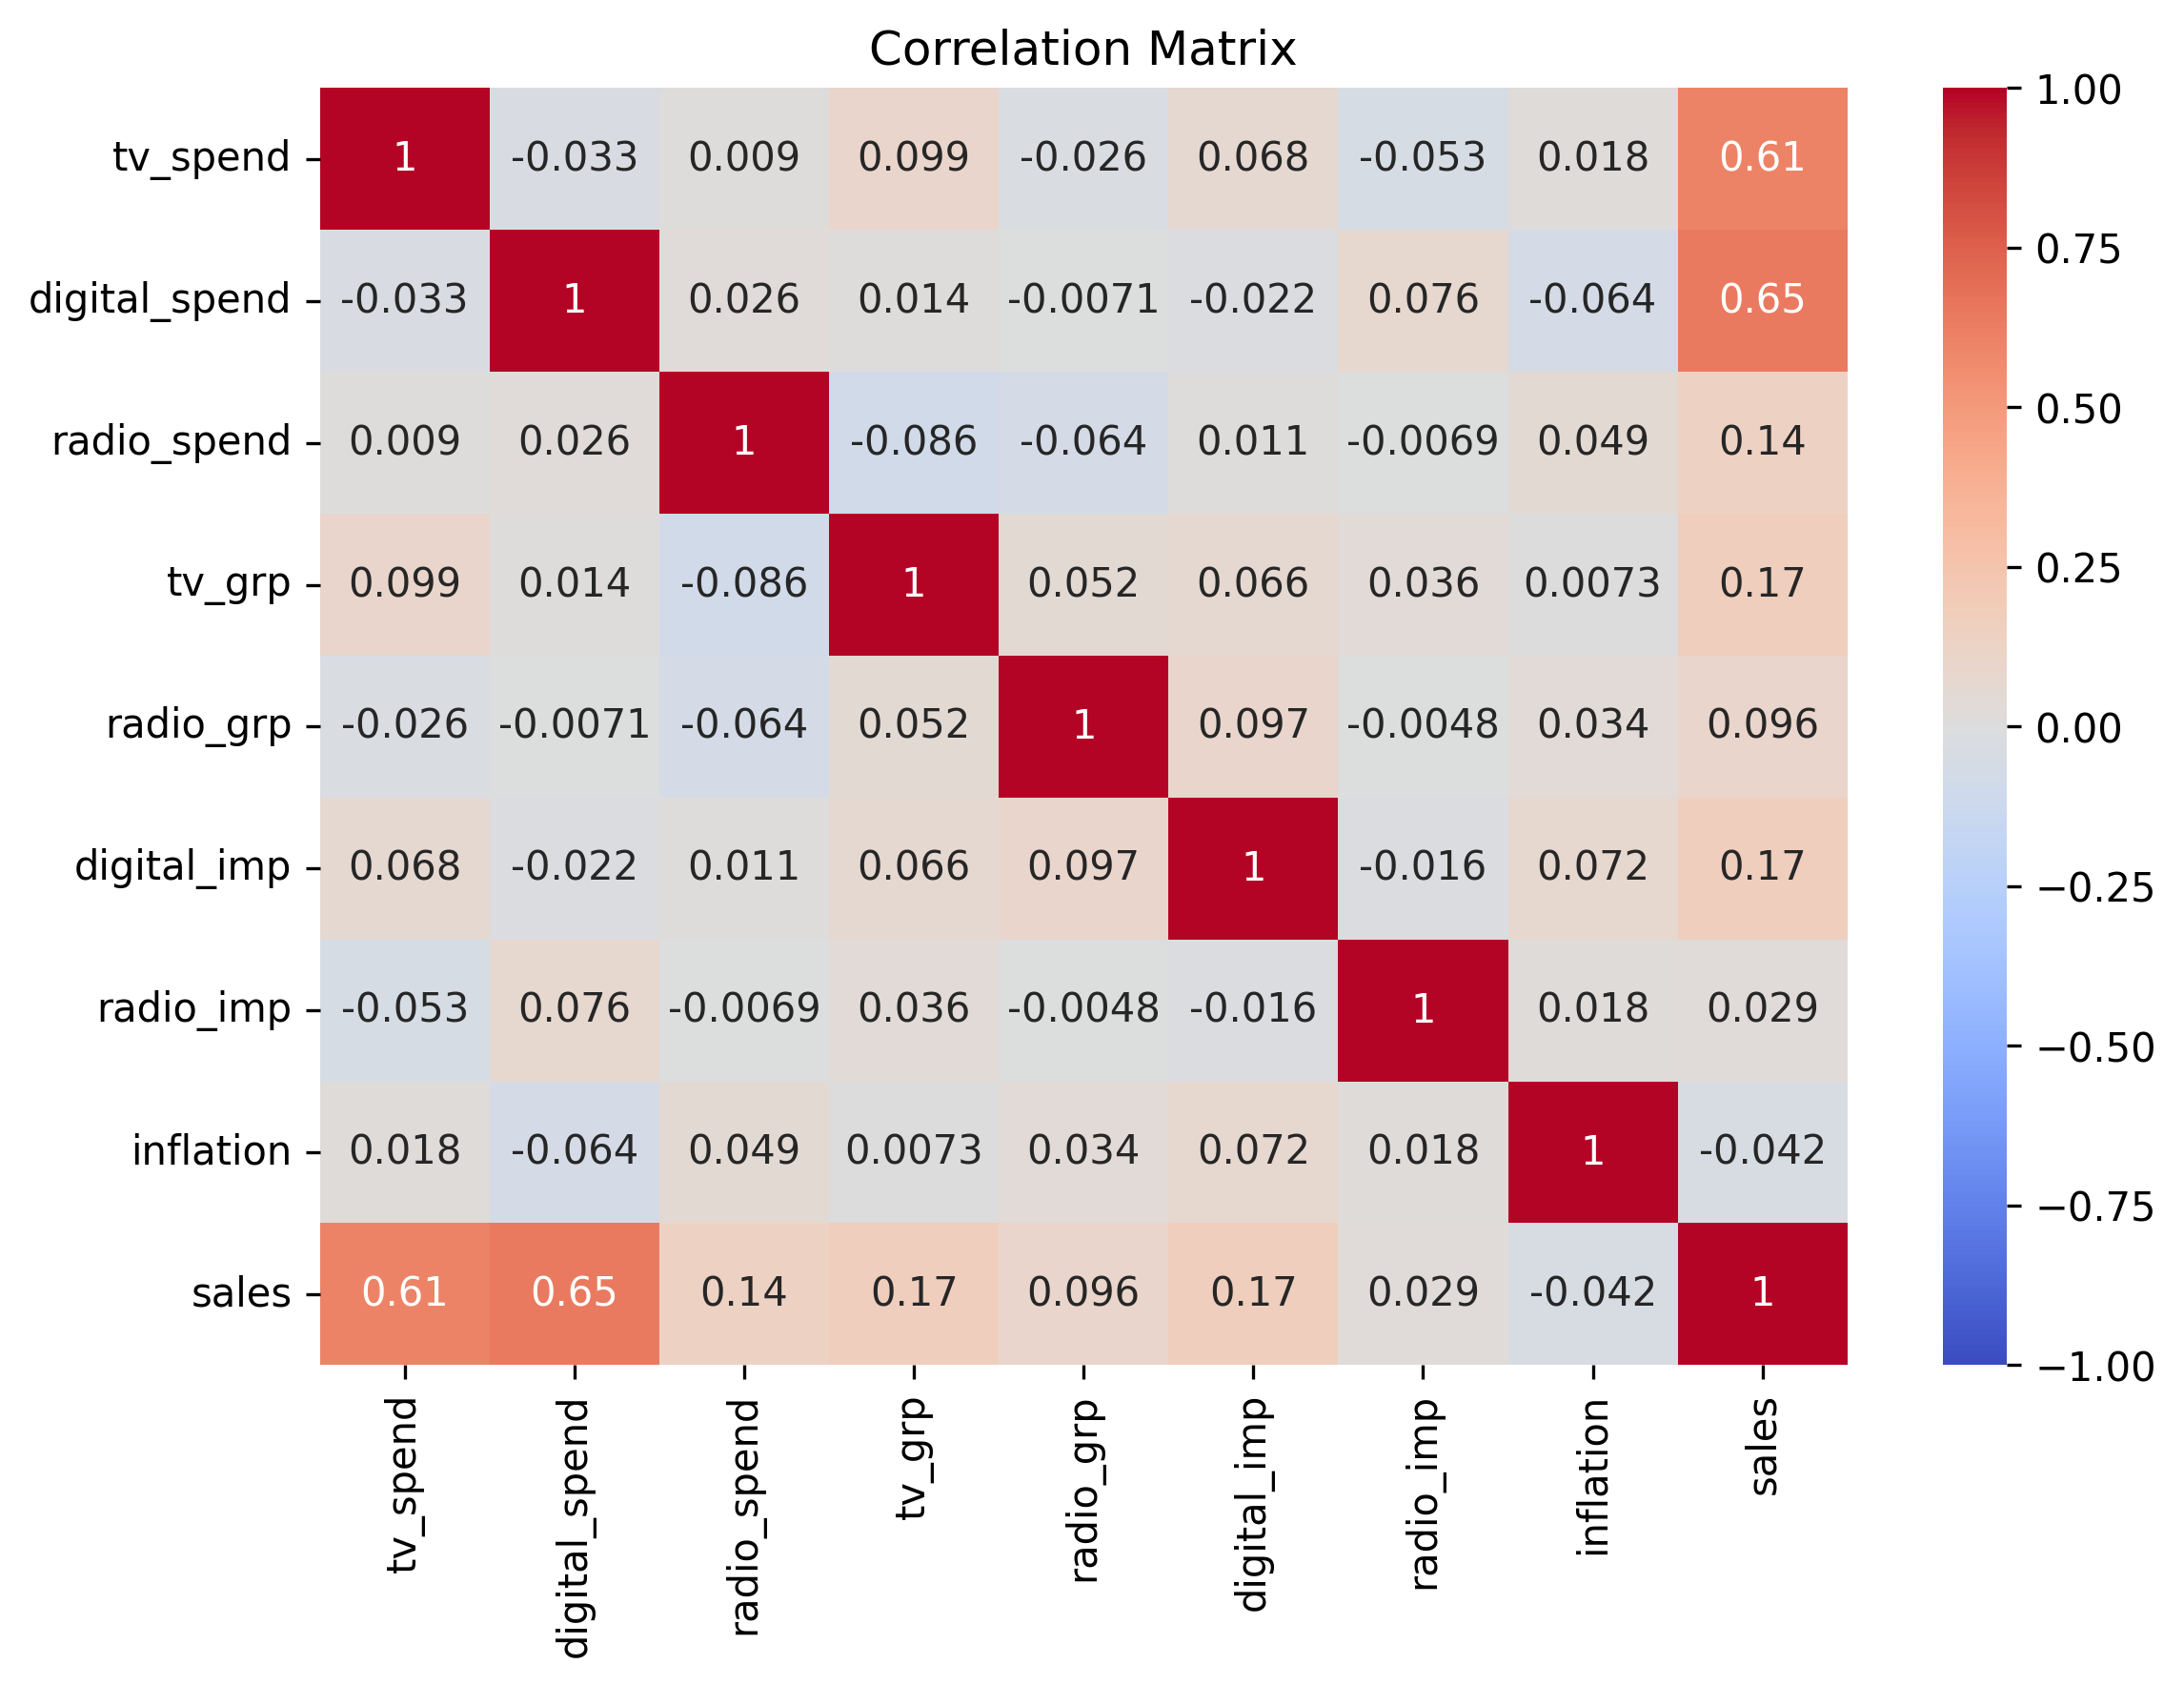
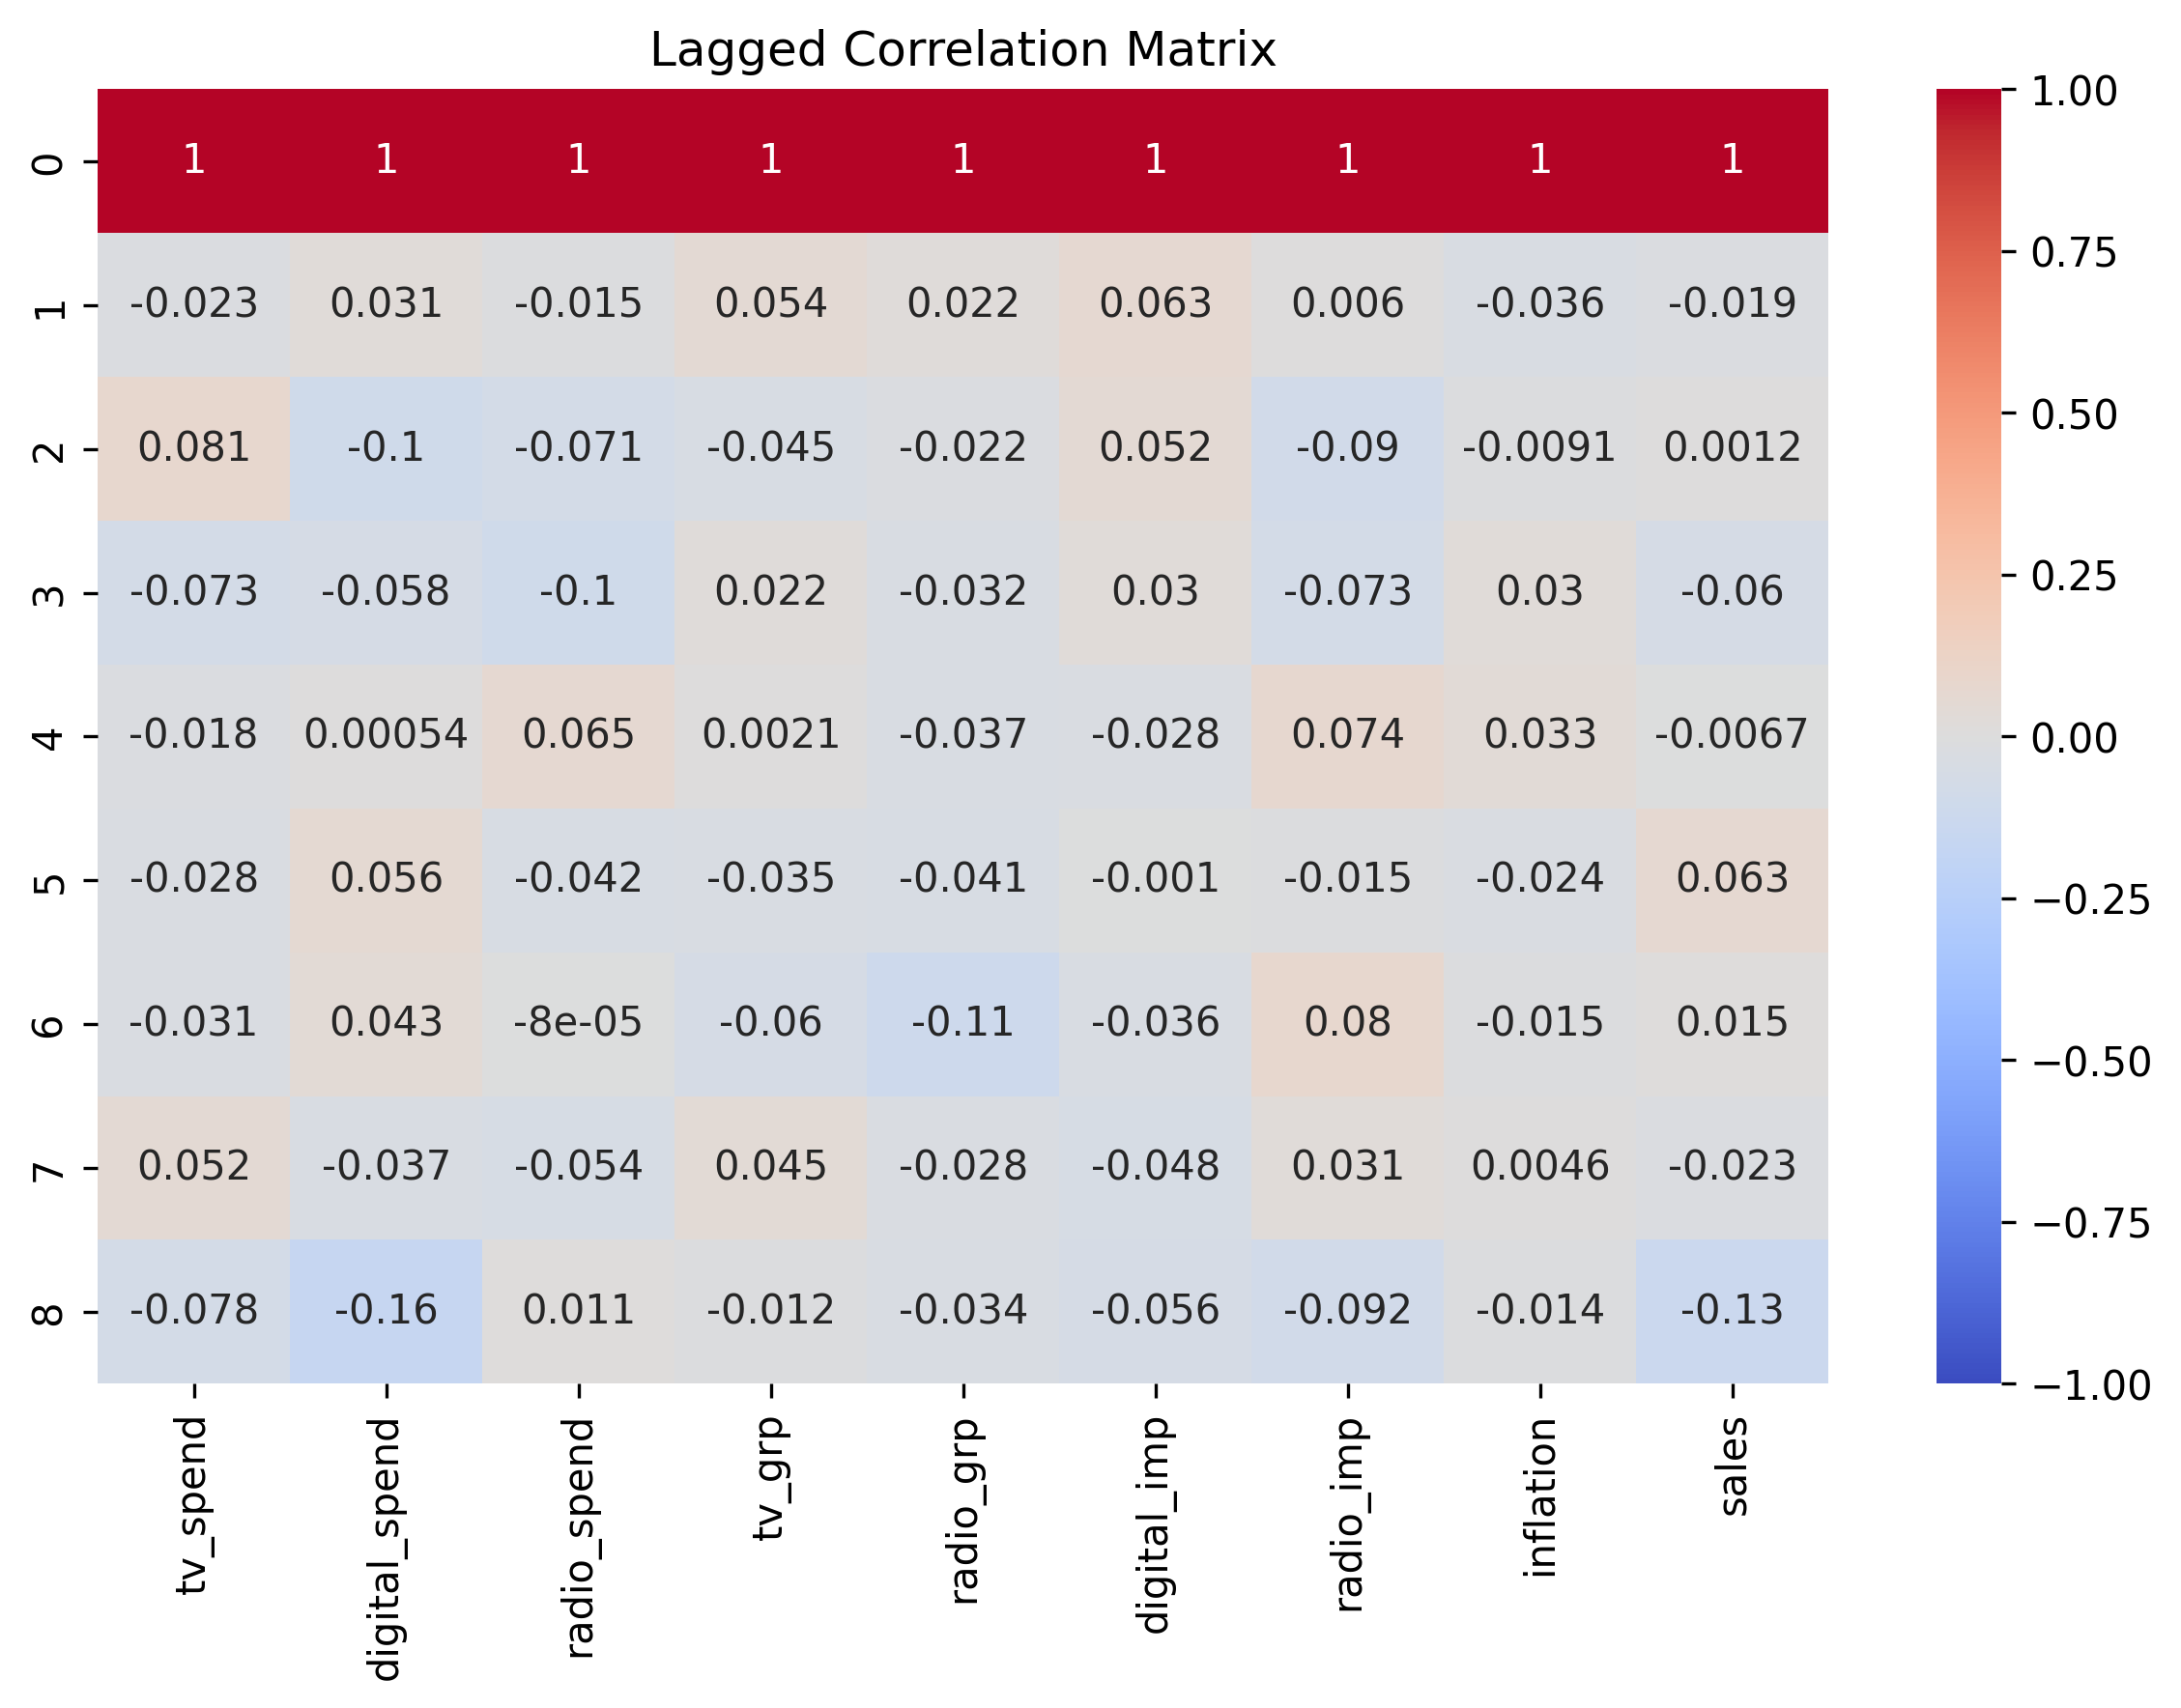
Plots the correlation matrix and lagged correlation matrix as heatmaps
Supports output directory customization
Leverages matplotlib and seaborn for visualization
Class Reference
- class owlmix.plotting.correlation.CorrPlotParams
Dataclass for specifying correlation plotting parameters.
- class owlmix.plotting.correlation.CorrelationPlotter(data, params)
Plots the correlation matrix and lagged correlation matrix for the provided data.
- Parameters:
data (
dict) – Dictionary containing correlation matrices (e.g., “correlation_matrix”, “lagged_correlation_matrix”).params (
CorrPlotParams) – Configuration parameters for correlation plotting.
- generate(output_dir: str = 'outputs/charts') tuple[str, str]
Generates and saves the correlation matrix and lagged correlation matrix heatmaps.
- Parameters:
output_dir (
str) – Directory to save the generated plots.- Returns:
Tuple of file paths to the saved correlation matrix and lagged correlation matrix images.
- Return type:
tuple[str, str]
Sample Output
Correlation Matrix and Lagged Correlation Matrix plots are heatmaps where each cell represents the correlation coefficient between two variables (or variable and lag). The color intensity indicates the strength and direction of the correlation.